Why it matters
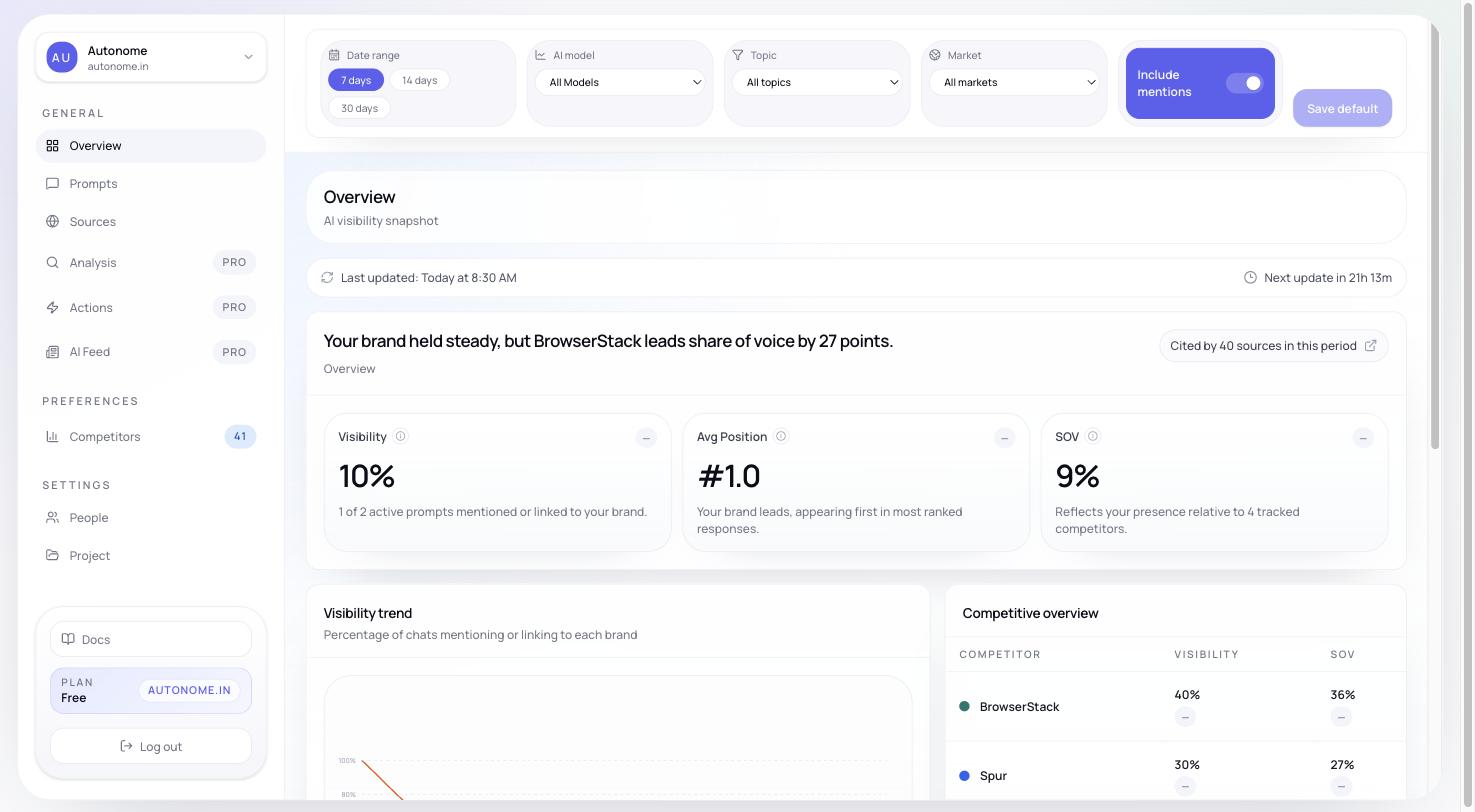
Overview is designed to answer one question fast: “Did something change, and do I know why?” It saves you from opening five separate pages each morning by showing the most important signals together.Start with the filters
The filter bar at the top controls every section on the page at once.| Filter | What it changes |
|---|---|
| Date range | The window used for trends and metric summaries |
| Model | The tracked model slice, when multiple models are available |
| Topic | The category-level slice you want to inspect |
| Market | The country and language slice |
Performance summary
The top metric cards show the current state of your selected slice at a glance. Each card also includes a trend indicator so you can see the direction of movement, not just the current number.| Metric | What it tells you |
|---|---|
| Visibility | How often your brand appears across tracked prompts. See Visibility for the full definition. |
| Share of Voice | How much of total brand appearances you own vs. competitors |
| Avg Rank | How high you appear when you are mentioned |
| Sentiment | Whether your mentions are framed positively or negatively |
If no runs have produced data yet, Overview shows setup banners and onboarding guidance instead of empty charts. Complete Onboarding to start seeing real data.
Diagnostic preview
On paid plans, a second row of scorecards appears below the main metrics:- Authority — how well-cited your brand’s web presence is
- Relevance — how well your content and catalog match tracked topics
- Readiness — how complete and structured your product data is
- Competitive gap — how your scores compare to the leading competitor
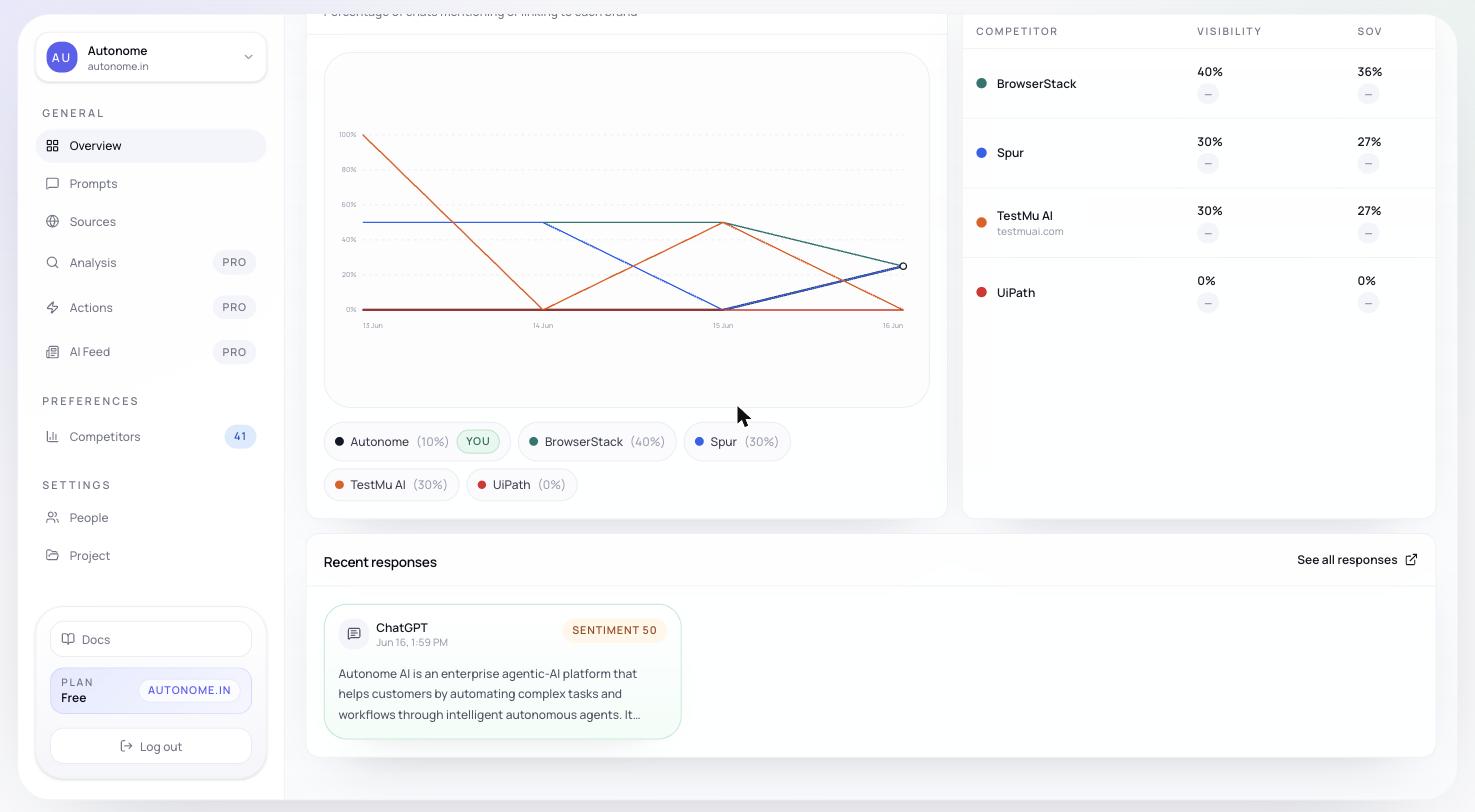
Competitive and source context
Below the summary cards, Overview becomes more operational:- Trend view — shows whether performance is moving in the right direction over the selected date range
- Competitive table — shows how your store ranks against detected brands on the same prompt set
- Source intelligence — highlights which domains are being cited and what kind of sources are shaping responses
Recent responses
- check whether your brand was mentioned at all
- inspect tone and positioning in natural language
- compare responses across markets or topics
- spot source and citation patterns before opening Sources or Analysis
Recommended workflow
Read the metric cards
Identify which metric moved — Visibility, Share of Voice, Rank, or Sentiment — and by how much.
Check the diagnostic row
On paid plans, the Authority / Relevance / Readiness / Competitive gap row tells you the likely root cause without any extra clicks.
Scan the competitive table and source intelligence
Confirm whether a competitor or a new source drove the change.
Next steps
Sources
See which domains and URLs are being cited — and which are missing from your footprint.
Analysis
Dig into Authority, Relevance, Readiness, and Competitive gap scores.
Actions
Turn diagnostic findings into concrete fixes for your catalog, content, and feeds.