> ## Documentation Index
> Fetch the complete documentation index at: https://citdhq.com/docs/llms.txt
> Use this file to discover all available pages before exploring further.
# Sources
> Inspect the domains and URLs cited in tracked AI responses to understand where authority is coming from.
The **Sources** page shows which websites and individual pages are being cited when AI models generate tracked responses. It is the clearest way to see where authority is flowing — and where it is not.
 ## Why Sources matter
Sources answer the questions that raw visibility numbers cannot:
* Is your own domain being cited, or only competitors?
* Which retailers, publishers, or review sites influence results?
* Are competitors getting cited by domains you never appear on?
* Is the problem broad domain coverage or a few missing key URLs?
If [Authority](/concepts/visibility) is low on the Overview diagnostic row, Sources is usually the next page to open.
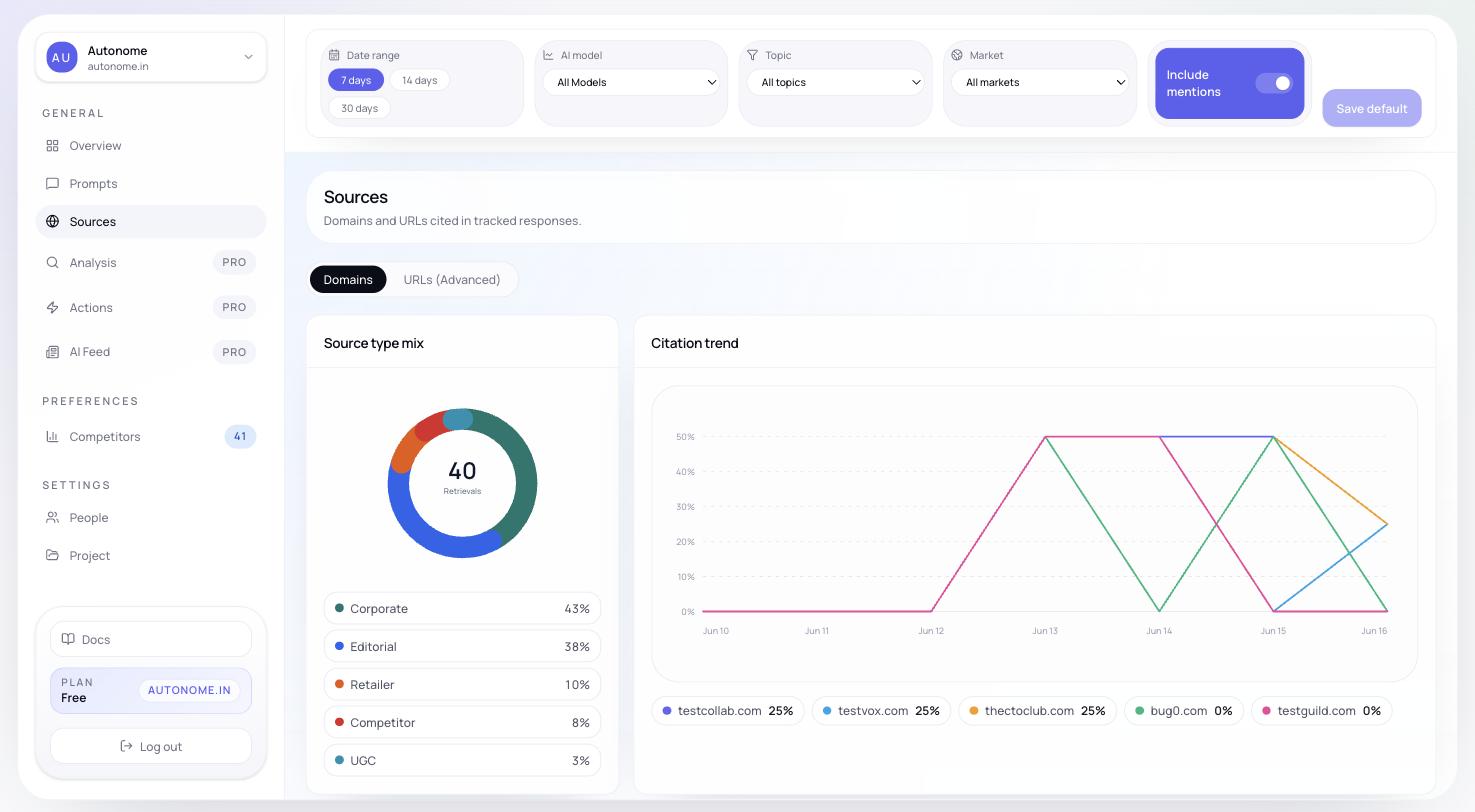
## Domains tab
The **Domains** tab rolls source evidence up to the site level. It is the right starting point for most investigations.
It includes:
* a **citation trend** chart showing how often domains were cited over the selected date range
* a **source type mix** chart breaking down citations by category (Editorial, Retailer, UGC, You, and so on)
* a **domain table** with the following columns:
| Column | Meaning |
| ------------------ | ------------------------------------------------------------------------- |
| **Domain Type** | Whether the source looks like Editorial, Retailer, UGC, or your own store |
| **Retrieved** | Percent of responses where the domain appeared as a source |
| **Retrieval Rate** | Average number of source retrievals per retrieved response |
| **Citation Rate** | Average number of inline citations per retrieved response |
Sort by **Retrieved** to find the domains with the broadest reach across your tracked prompts. Sort by **Citation Rate** to find the domains that carry the most weight when they do appear.
The source type mix chart is especially useful for spotting when an entire category of source — for example, editorial review sites — is missing from your footprint. A hiking-gear store that is absent from outdoor-lifestyle publications will show a gap in the Editorial slice even if the Retailer slice looks healthy.
## URLs tab
The **URLs** tab drops to page level so you can inspect specific source pages.
Each row shows:
* page title or URL
* detected URL type
* total retrievals
* retrieval rate
* citation rate
* last cited time
Use this view when a domain looks important in the Domains tab and you want to see which exact pages are carrying influence.
## URL details
Opening a URL row shows a lightweight detail view with:
* whether your brand is mentioned on the page
* whether tracked competitors are mentioned on the page
* retrieval and citation metrics for that URL
The current version focuses on citation and mention evidence. It does not yet expose a full crawled page-content view inside the source detail panel.
This is especially useful for spotting pages that already mention competitors but not you — those are high-priority targets for outreach, content placement, or product-data updates.
## How to use Sources alongside Analysis
Sources and [Analysis](/features/analysis) work well together:
* use **Sources** to see *where* evidence is coming from (which sites, which pages)
* use **Analysis** to understand *why* missing or weak citation coverage is hurting your Authority, Relevance, or Readiness scores
Look for missing categories. If Editorial is thin, that is a content-placement gap. If Retailer is thin, your products may not be stocked or reviewed on major platforms.
Find the domains that appear most broadly. Are you present on them?
For any domain where competitors appear but you do not, check the URL detail to confirm you are absent, then prioritize getting mentioned.
If Authority is low, the citation gaps you found in Sources explain it. Go to [Analysis](/features/analysis) for the scored breakdown and recommended fixes.
## Next steps
Turn citation-gap findings into scored diagnostics and root-cause detail.
Act on citation gaps — content outreach, retailer listings, feed improvements.
Return to the Overview to see how source changes affect top-line metrics.
Look up terms like Retrieval Rate, Citation Rate, and Authority.
## Why Sources matter
Sources answer the questions that raw visibility numbers cannot:
* Is your own domain being cited, or only competitors?
* Which retailers, publishers, or review sites influence results?
* Are competitors getting cited by domains you never appear on?
* Is the problem broad domain coverage or a few missing key URLs?
If [Authority](/concepts/visibility) is low on the Overview diagnostic row, Sources is usually the next page to open.
## Domains tab
The **Domains** tab rolls source evidence up to the site level. It is the right starting point for most investigations.
It includes:
* a **citation trend** chart showing how often domains were cited over the selected date range
* a **source type mix** chart breaking down citations by category (Editorial, Retailer, UGC, You, and so on)
* a **domain table** with the following columns:
| Column | Meaning |
| ------------------ | ------------------------------------------------------------------------- |
| **Domain Type** | Whether the source looks like Editorial, Retailer, UGC, or your own store |
| **Retrieved** | Percent of responses where the domain appeared as a source |
| **Retrieval Rate** | Average number of source retrievals per retrieved response |
| **Citation Rate** | Average number of inline citations per retrieved response |
Sort by **Retrieved** to find the domains with the broadest reach across your tracked prompts. Sort by **Citation Rate** to find the domains that carry the most weight when they do appear.
The source type mix chart is especially useful for spotting when an entire category of source — for example, editorial review sites — is missing from your footprint. A hiking-gear store that is absent from outdoor-lifestyle publications will show a gap in the Editorial slice even if the Retailer slice looks healthy.
## URLs tab
The **URLs** tab drops to page level so you can inspect specific source pages.
Each row shows:
* page title or URL
* detected URL type
* total retrievals
* retrieval rate
* citation rate
* last cited time
Use this view when a domain looks important in the Domains tab and you want to see which exact pages are carrying influence.
## URL details
Opening a URL row shows a lightweight detail view with:
* whether your brand is mentioned on the page
* whether tracked competitors are mentioned on the page
* retrieval and citation metrics for that URL
The current version focuses on citation and mention evidence. It does not yet expose a full crawled page-content view inside the source detail panel.
This is especially useful for spotting pages that already mention competitors but not you — those are high-priority targets for outreach, content placement, or product-data updates.
## How to use Sources alongside Analysis
Sources and [Analysis](/features/analysis) work well together:
* use **Sources** to see *where* evidence is coming from (which sites, which pages)
* use **Analysis** to understand *why* missing or weak citation coverage is hurting your Authority, Relevance, or Readiness scores
Look for missing categories. If Editorial is thin, that is a content-placement gap. If Retailer is thin, your products may not be stocked or reviewed on major platforms.
Find the domains that appear most broadly. Are you present on them?
For any domain where competitors appear but you do not, check the URL detail to confirm you are absent, then prioritize getting mentioned.
If Authority is low, the citation gaps you found in Sources explain it. Go to [Analysis](/features/analysis) for the scored breakdown and recommended fixes.
## Next steps
Turn citation-gap findings into scored diagnostics and root-cause detail.
Act on citation gaps — content outreach, retailer listings, feed improvements.
Return to the Overview to see how source changes affect top-line metrics.
Look up terms like Retrieval Rate, Citation Rate, and Authority.